Optima Solusi

HomeWhat You Can See in the Optima Client Dashboard

What You Can See in the Optima Client Dashboard

Every Optima client gets the same dashboard, included in the core package, not a premium feature sold separately.

Most website packages stop caring once the site is live: you get the files, then you're on your own to check whether the site is healthy. Optima includes a client dashboard in the core package, so you can check your website status, see where visitors are coming from, and know how many leads came in, without opening Search Console, Google Ads, and GA4 one by one. This page walks through what's actually inside it, with screenshots from the live demo you can open yourself.

If you only read this

  • One passwordless email link shows domain, email, SSL, and AI/GEO readiness status, checked automatically every day at 3 AM.
  • Leads from every channel (ads, chatbot, site forms) land in one list, each with its source down to the UTM campaign level.
  • Organic clicks, keywords, and Google index status are pulled straight from Search Console, no need to open that account yourself.
  • Add-on modules (ads, chatbot, Google Business Profile, recruitment) show up automatically on the same page once you turn them on.
  • The demo dashboard is public. The numbers are illustrative, but the mechanics are exactly what you'll use, charts that genuinely move, not static images.

01

Why this is rare at small-business pricing

A dashboard like this usually only shows up in enterprise services billed in the millions of rupiah a month, not in a small-business package.

Building a website is one job. Keeping it healthy, trackable, and easy to evaluate is a different job, one that usually gets dropped the moment the project ships. You know the site is live, but you don't know how much longer the domain is registered for, whether your business email is landing in spam, or which channel visitors are actually coming from, until one day all of it becomes a problem at once.

Optima's client dashboard exists to close that gap, and it's included in the core package rather than sold separately as a premium feature. Every client, from the ones on the basic package to the ones running every add-on, signs in at the same address: dashboard.<yourdomain>.id, through a link sent to their email, no password to remember.
How it works technically

02

Overview: visitors, leads, and a health score on one screen

The numbers clients ask about most sit right at the top, no clicking required.

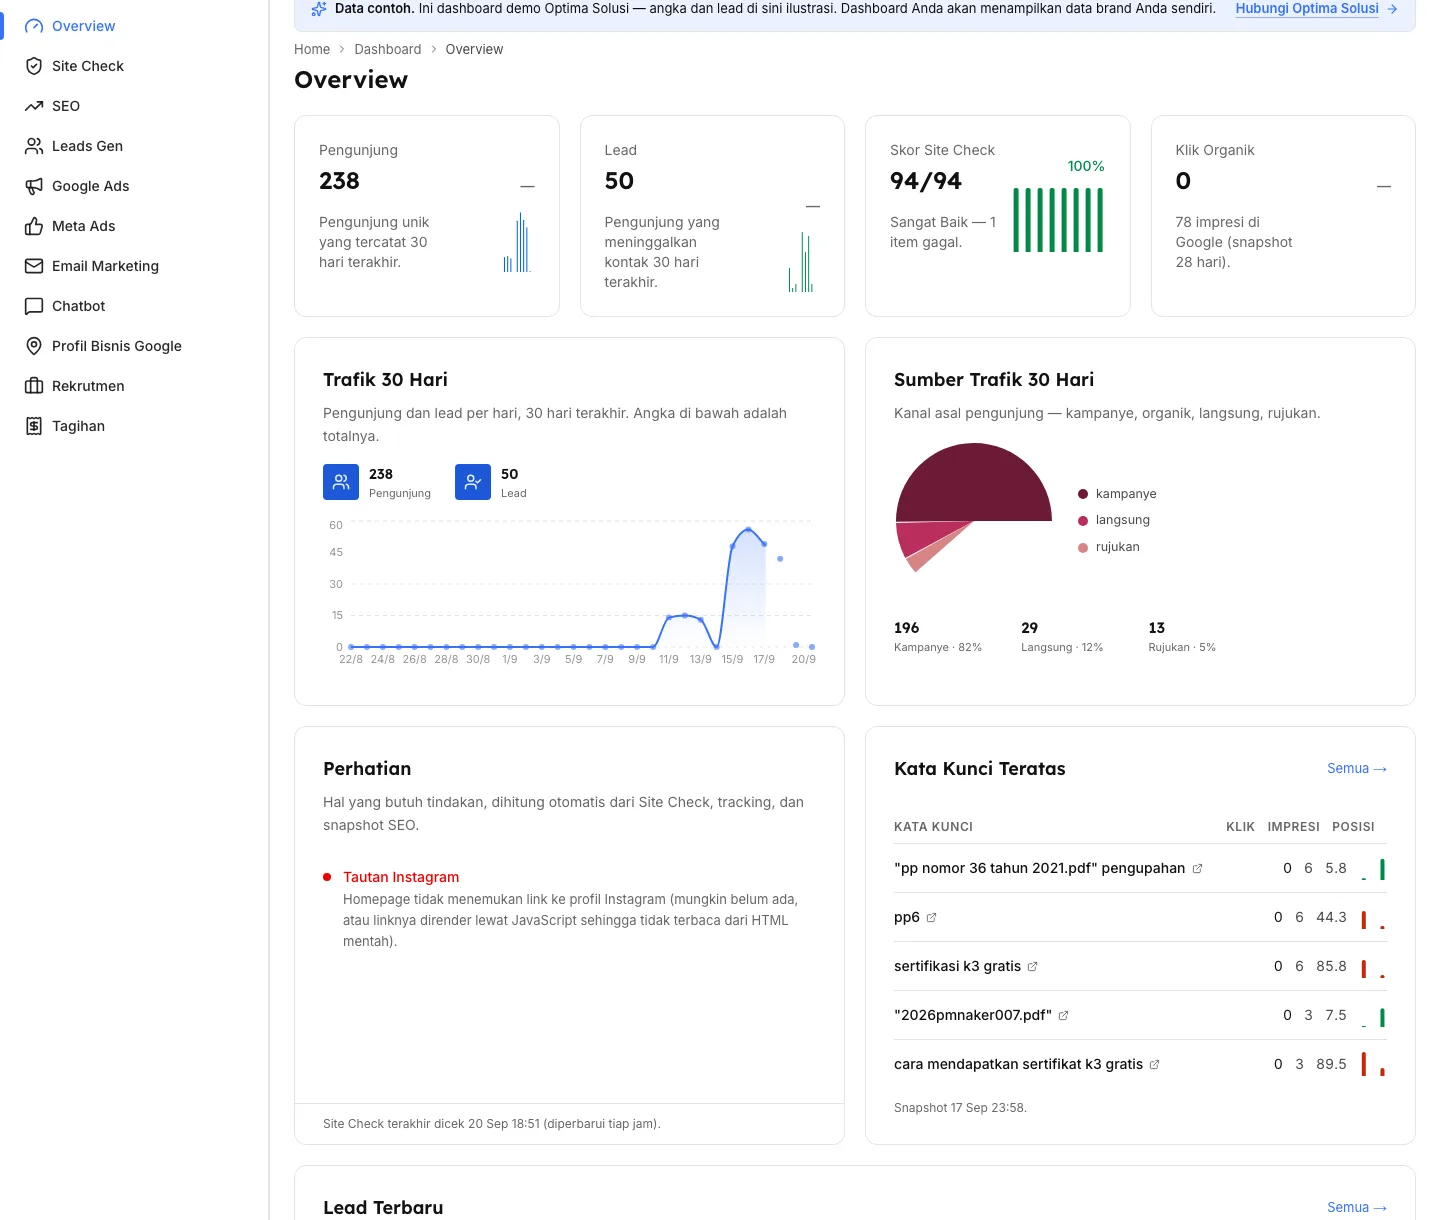
The first page you land on is Overview: unique visitors and leads over the last 30 days, your Site Check score, and organic clicks from Google, four cards at once. Below that is a daily traffic chart and a traffic-source breakdown (campaign, organic, direct, referral), so you know straight away which channel is actually working.

There's also an "Attention" card that automatically pulls together anything that needs action from Site Check, tracking, or the latest SEO snapshot. You don't have to comb through every page yourself to find out something's wrong.

Overview page of the Optima client dashboard: visitors, leads, Site Check score, and traffic sources

03

Site Check: domain, email, and security checked every day

23 automated checks rolled into one score: green healthy, yellow needs attention, red a problem.

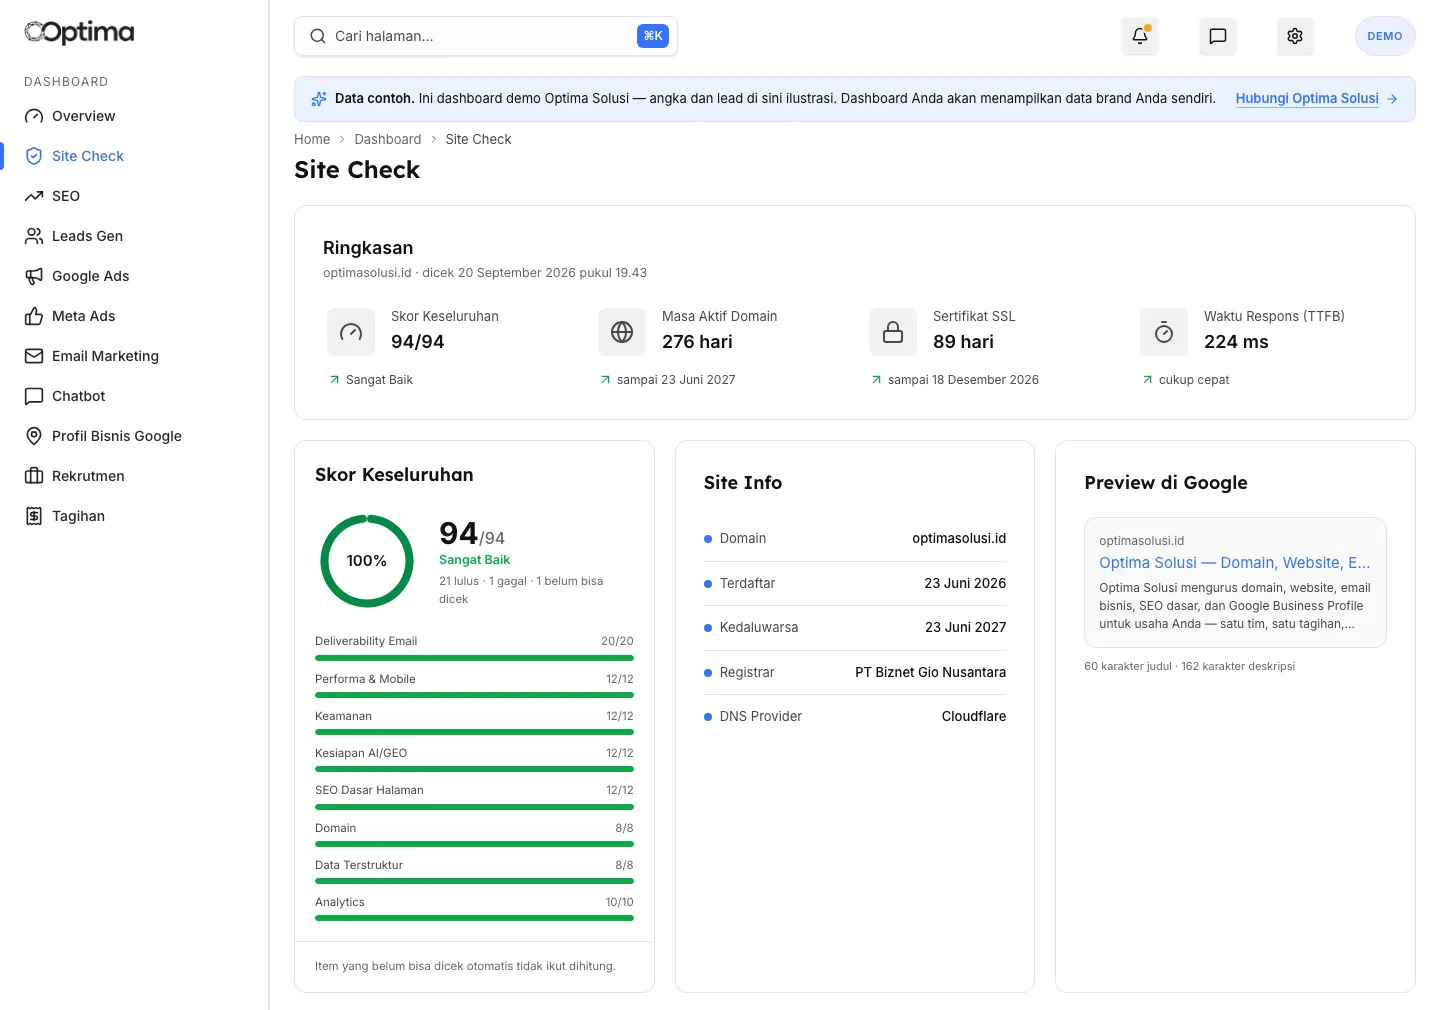
Every day at 3 AM WIB, Optima's system checks your domain: SPF, DKIM, DMARC for email; DNSSEC and domain expiry; HTTPS and SSL certificate validity; and domain reputation through Google Safe Browsing. The result is stored as a score, 94 out of 94 checkable points in this example, so you don't need to understand the jargon to know whether your site is fine or not.

The Site Info card shows registration and expiry dates, registrar, and DNS provider in one place. The Google Preview card shows exactly what people see when your site shows up in search results, including the character count on your title and meta description.

  • Email deliverability: SPF, DKIM, DMARC
  • Performance, mobile, and security: HTTPS, forced redirects, SSL certificate
  • AI/GEO readiness: robots.txt and llms.txt for GPTBot, ClaudeBot, PerplexityBot
  • Basic on-page SEO, structured data, and analytics
Site Check page of the Optima client dashboard: site health score, domain info, and Google search preview

04

SEO: clicks and keyword position without opening Search Console yourself

Data that's usually locked behind your own Google Search Console account, pulled straight into the dashboard.

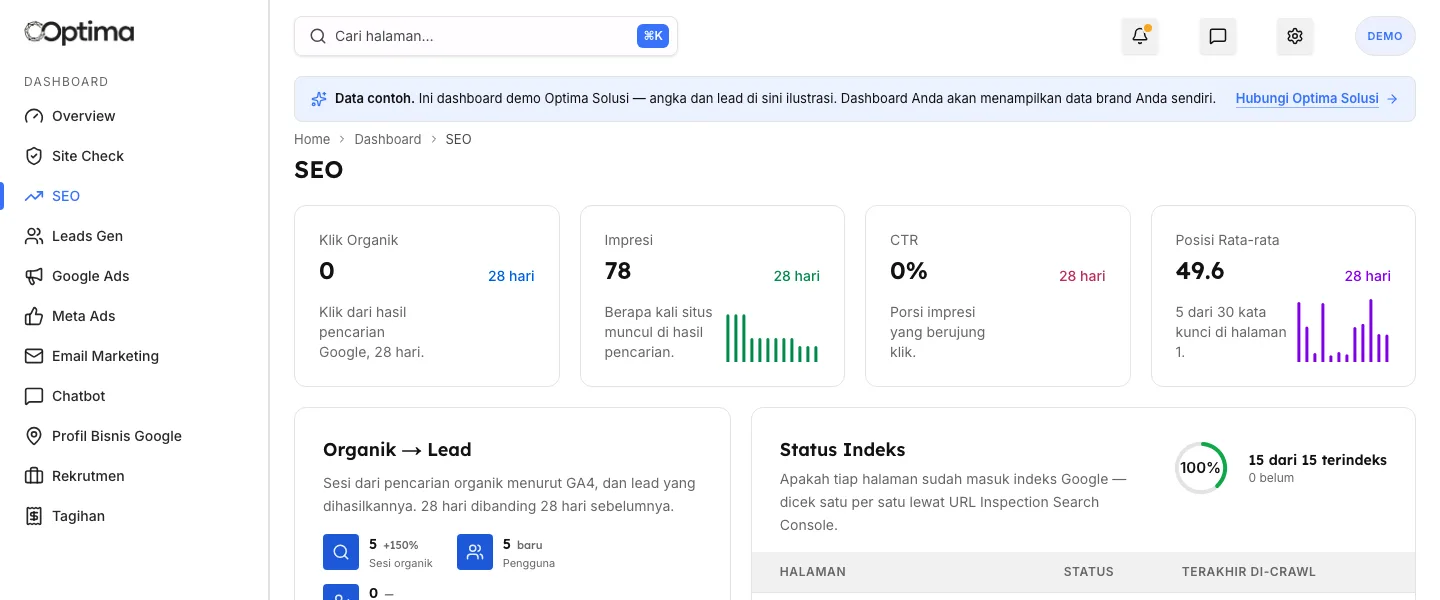
Organic clicks, impressions, CTR, and average keyword position are pulled from Search Console every day. You can see how many pages are indexed by Google, and which keywords are actually driving clicks, without needing your own Search Console account or learning how to read it.

This is also tied to leads: how many sessions from organic search turned into a lead, compared with the 28 days before. So it's not just whether the site shows up in Google, but whether showing up is actually bringing in prospects.

SEO page of the Optima client dashboard: organic clicks, impressions, CTR, and average keyword position from Search Console

05

Leads from every channel, and add-on modules that show up automatically

Every lead, whether from ads, chatbot, or a site form, lands in one list with its own source, not scattered across separate places.

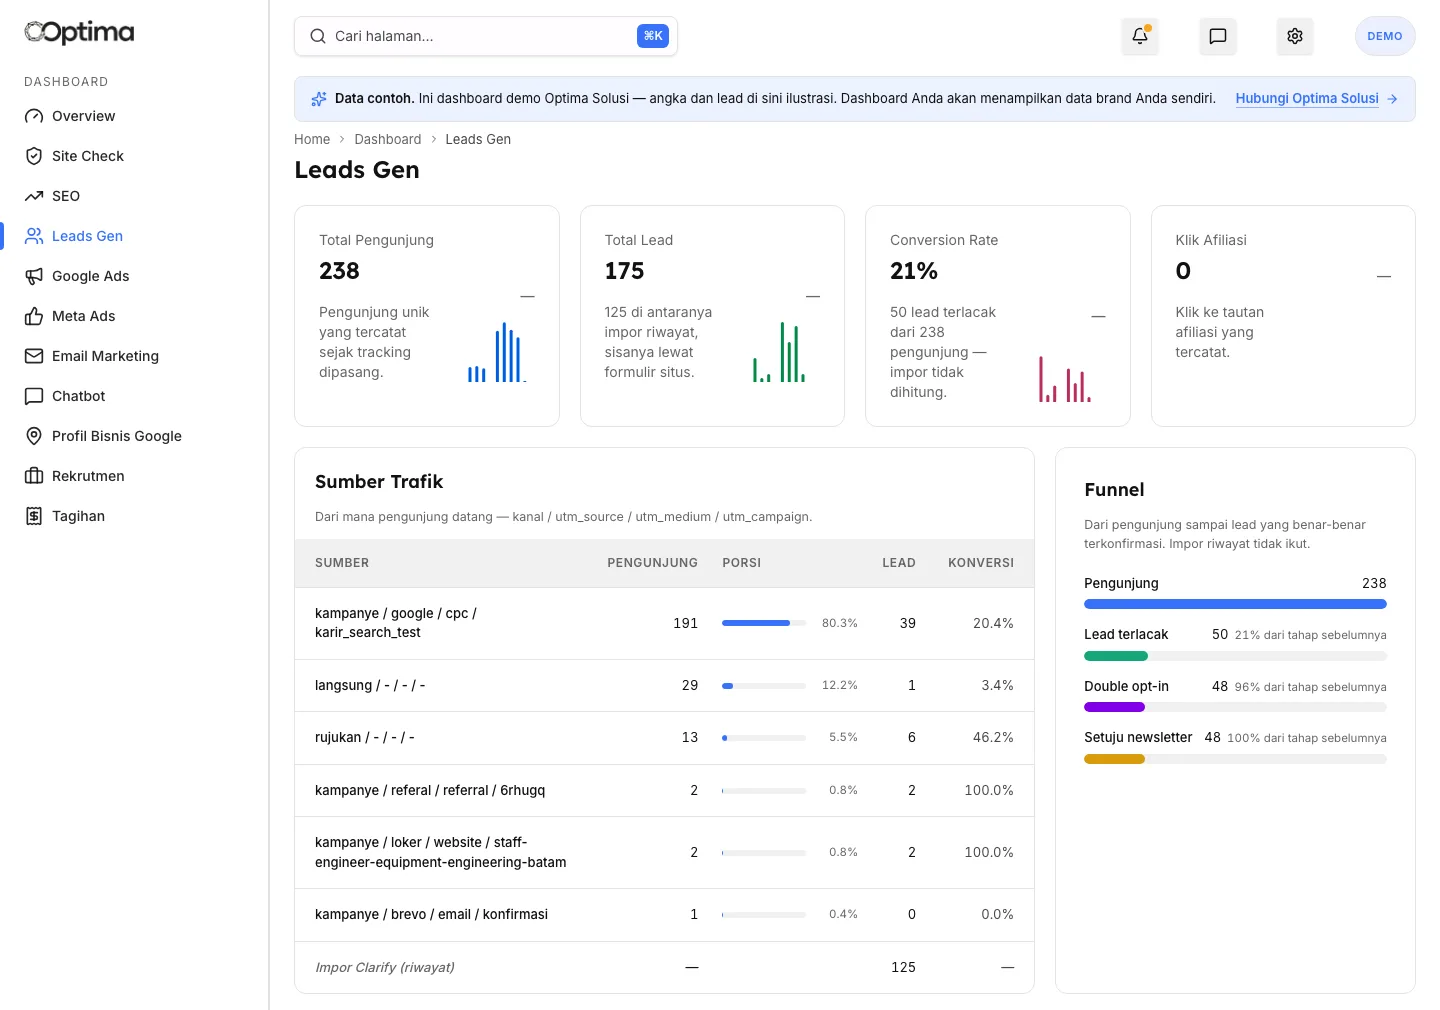
Leads Gen shows total visitors and leads, conversion rate, and, most importantly, which channel a lead came from, down to the UTM campaign. There's also a funnel from visitor to confirmed lead, so you can see exactly where most prospects drop off.

Turn on an add-on, and its module shows up automatically in the same sidebar: Google and Meta ad performance with cost per lead, Chatbot AI quota and conversations, Google Business Profile, and Recruitment. There's no separate page to remember, it all lives on the same dashboard.

Leads Gen page of the Optima client dashboard: total visitors, leads, traffic sources, and conversion funnel

How ad budget works · A chatbot that learns from customer questions

06

How you sign in: an email link, not a password you'll forget

You sign in through a link sent to your business email, valid for 15 minutes and usable once.

There's no password to remember or reset. You open dashboard.<yourdomain>.id, enter your email, and a sign-in link lands in your inbox, valid for 15 minutes and usable only once. The session is tied to your own business, so that link can never be used to open another client's dashboard.

Client dashboard, technical details

07

Try it yourself before you're a client

The demo dashboard is public, not a mockup. The data is pulled from a real client and masked to protect their privacy.

Rather than take our word for it, you can open the demo dashboard right now. Every number in it is illustrative and masked to protect the original client's privacy, but the shape and mechanics are exactly what you'd use, including charts that genuinely move based on real data, not static images.

Open the demo dashboard

FAQ

Frequently asked questions

Is the dashboard part of the base package, or a separate add-on?
It's part of the core package. Every Optima client, from the most basic package to one running every add-on, gets access to the same dashboard. The modules shown adjust to whichever add-ons are active.
How often is the dashboard data updated?
Site Check runs automatically every day at 3 AM WIB. Visitor and lead data is recorded as it happens. SEO snapshots and ad performance are updated manually on the team's schedule, usually weekly.
Do I need to understand technical terms to make sense of the dashboard?
No. Every card is written in plain language, "healthy", "needs attention", "a problem", rather than just technical abbreviations like SPF or DNSSEC with no explanation.
Who else can see my business's dashboard?
Only the accounts you register with us. Access is through a one-time email link, and the session is tied to your own business, it can't be used to open another client's dashboard.
Can I try the dashboard before signing up?
Yes. The public demo dashboard at demo.optimasolusi.id shows the same layout and mechanics, with sample data pulled from one client, then masked to protect their privacy.

Want to see a dashboard for your own business?

Check out the demo first, or go straight to a free consultation to get started.

Get a Free Quote